Overview of data
Below are tables showing a simplified overview of how the PlantWatch data were organized (Table 3), and the number of recorded observations for each species by phase (Table 4). The phase definitions are included in the table heading.
Table 3. Simplified version of the PlantWatch data table. Information includes a location identifier (LC_ID), latitude and longitude of the sampling location (Lat_Dec, Long_Dec), an observation identifier for each individual observation (OBS_ID), personal registration number of each PlantWatch volunteer (PREG), elevation of the sampling location in metres (Elev_m_DEM), a species identification number (SP - described in Table 4), plant phase identifier (PH - described in Table 4), month, day, and year where the observation took place, and that day in Julian days (doy), as well as the Seedzone, Natural Subregion (NSRNAME), and landcover classification of the surrounding landscape for each observation location.
Table 3. Simplified version of the PlantWatch data table. Information includes a location identifier (LC_ID), latitude and longitude of the sampling location (Lat_Dec, Long_Dec), an observation identifier for each individual observation (OBS_ID), personal registration number of each PlantWatch volunteer (PREG), elevation of the sampling location in metres (Elev_m_DEM), a species identification number (SP - described in Table 4), plant phase identifier (PH - described in Table 4), month, day, and year where the observation took place, and that day in Julian days (doy), as well as the Seedzone, Natural Subregion (NSRNAME), and landcover classification of the surrounding landscape for each observation location.
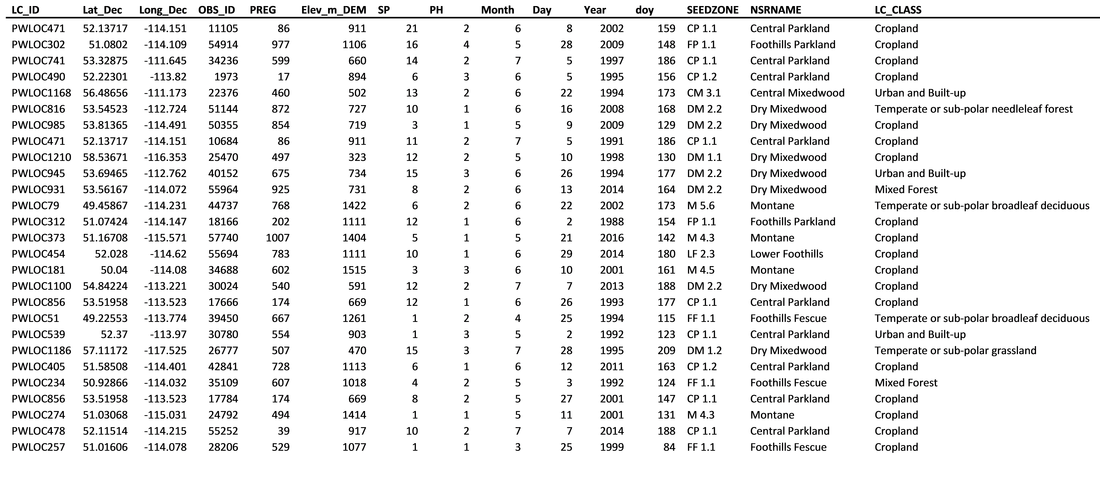
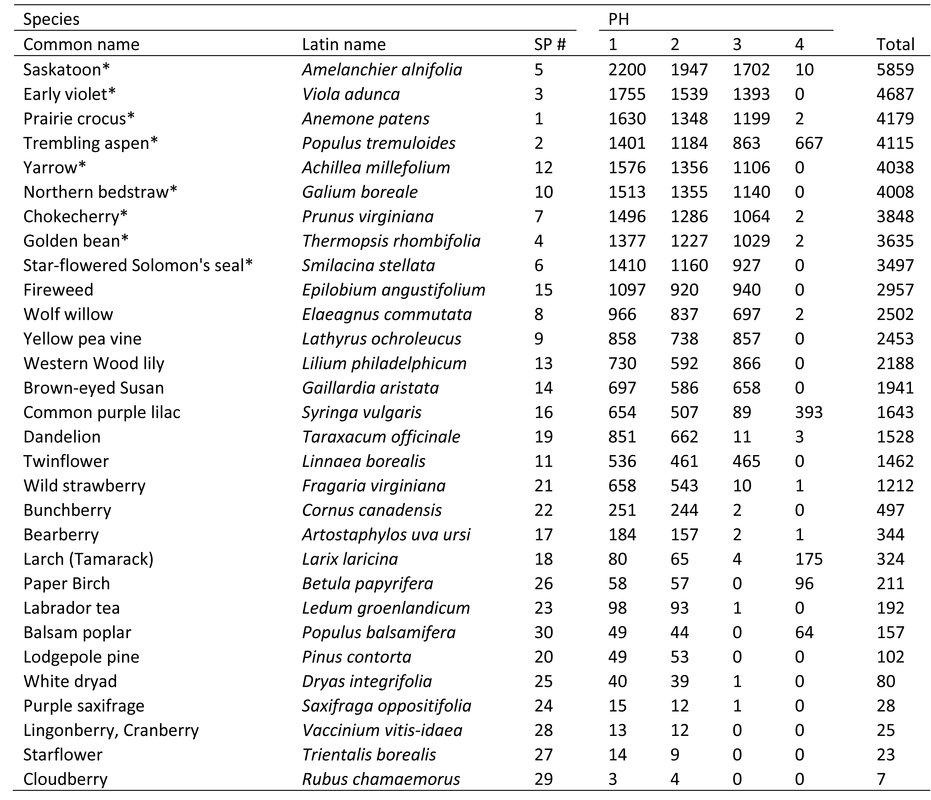
Table 4. Total number of records by phase (PH) for each plant species [given is common name, scientific name and species identification code (SP #)] recorded by PlantWatch observers in Alberta (phase 1: first flowers open, phase 2: ~50% of flowers open, phase 3: 90% of flowers open, phase 4: first leaves unfurled in 3 places on tree/shrub), (* denotes the species used to developed the mixed model which estimated aspen leaf-out and saskatoon bloom dates by natural subregion).
Spring flowering times
Below are boxplots showing the distribution of reported aspen and saskatoon first bloom dates in the Central Parkland region of Alberta. In most years, the data appear to be normally distributed; however, the range in observations is highly variable among years. For example, aspen bloom has a wide range in 2015, but a very narrow range in 2016. The range in reported saskatoon bloom dates appears to be narrower than aspen in most years. There are also outliers in many years, some of which are extreme (e.g., aspen in 2005). This highlights the need to compare PlantWatch data with remote sensing data at the Natural Subregion level, instead of at the pixel/sampling site level. The potential of observer bias and error could make it difficult to find interesting relationships at the pixel level, while aggregating data regionally should compensate for this.
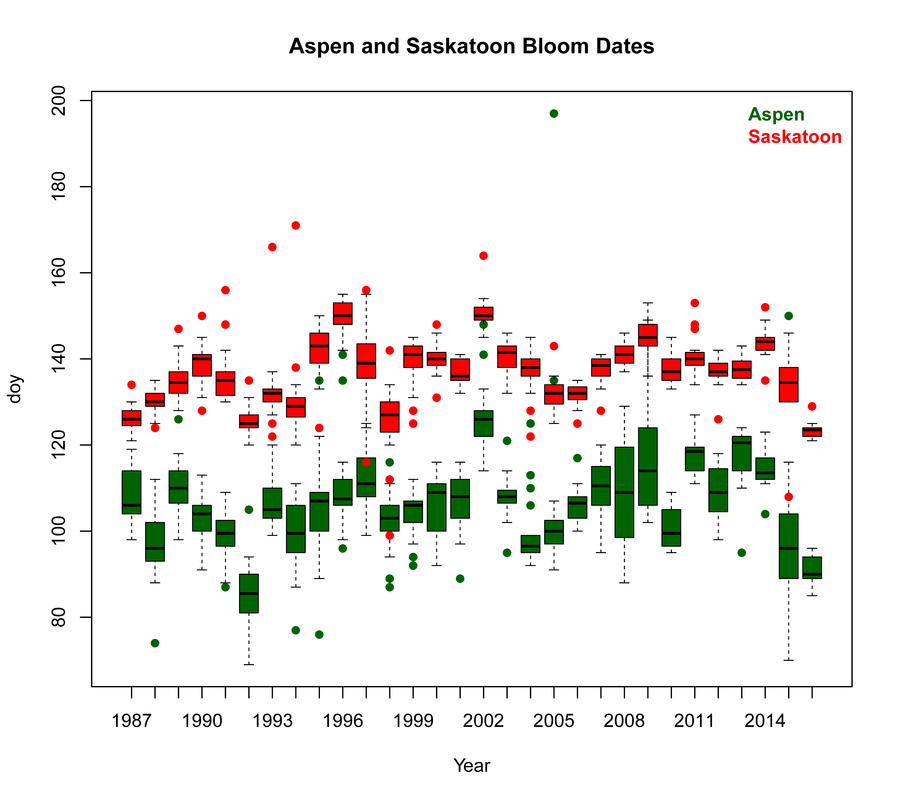
Figure 4. Boxplots for first bloom dates (phase 1) of trembling aspen (Populus tremuloides) and saskatoon (Amelanchier alnifolia) in the Central Parkland region of Alberta between 1987 and 2016 from the data collected by PlantWatch citizen science volunteers..
