PlantWatch
The Alberta PlantWatch citizen science network was initiated in 1987 to track spring plant phenology in the province of Alberta. Citizen volunteers were recruited through promotion via newspaper articles, government newsletters, public talks, radio interviews, and conference posters (Beaubien and Hamann 2011b). These citizen volunteers collected data on spring flowering and leafout dates for easily identifiable, and common species across Alberta. As of 2016, these data include over 57,000 records for 30 species taken by roughly 700 observers.
An overlay analysis was done to determine which Natural Subregions are best sampled by the PlantWatch data (Figure 1, Table 1) followed by an additional overlay analysis to determine which landcover types are best sampled by the PlantWatch data within each Natural Subregion (Table 2). Random sampling points were then manually created for the best sampled Natural Subregion (NSR) and Land Cover (LC) combinations (Figure 2). Three Natural Sugregions were combined to be the "grasslands" region (Mixedgrass, Foothills Fescue, and Dry Mixedgrass). Fifty points were created for each of these selected 11 combinations, for a total of 550 points. These random points were then used to extract the raster values of the remote sensing datasets to determine mean greenup in each selected Natural Subregion by landcover type. An additional 125 random points had to be created for extracting raster values from the Pickell et al. (2017) remote sensing data due to poor coverage of this remote sensing data in certain locations in some years (total of 675 points).
An overlay analysis was done to determine which Natural Subregions are best sampled by the PlantWatch data (Figure 1, Table 1) followed by an additional overlay analysis to determine which landcover types are best sampled by the PlantWatch data within each Natural Subregion (Table 2). Random sampling points were then manually created for the best sampled Natural Subregion (NSR) and Land Cover (LC) combinations (Figure 2). Three Natural Sugregions were combined to be the "grasslands" region (Mixedgrass, Foothills Fescue, and Dry Mixedgrass). Fifty points were created for each of these selected 11 combinations, for a total of 550 points. These random points were then used to extract the raster values of the remote sensing datasets to determine mean greenup in each selected Natural Subregion by landcover type. An additional 125 random points had to be created for extracting raster values from the Pickell et al. (2017) remote sensing data due to poor coverage of this remote sensing data in certain locations in some years (total of 675 points).
Mixed Models
Mixed models were developed for the PlantWatch data to estimate the date of important phenological events for the selected subregions where the most observations exist. We created a BLUP (best linear unbiased prediction) mixed model with the year, Natural Subregion, and species as random effects and phenological phase as the fixed effect, which estimated the date for phases 1, 2, & 3 (and phase 4 for Aspen) of the 9 best sampled species (Table 3) in the six selected ecoregions (Figure 2). We then used the estimation of saskatoon (Amelanchier alnifolia) first bloom (phase 1) and aspen (Populus tremuloides) leaf-out (phase 4) to test against the remote sensing data.
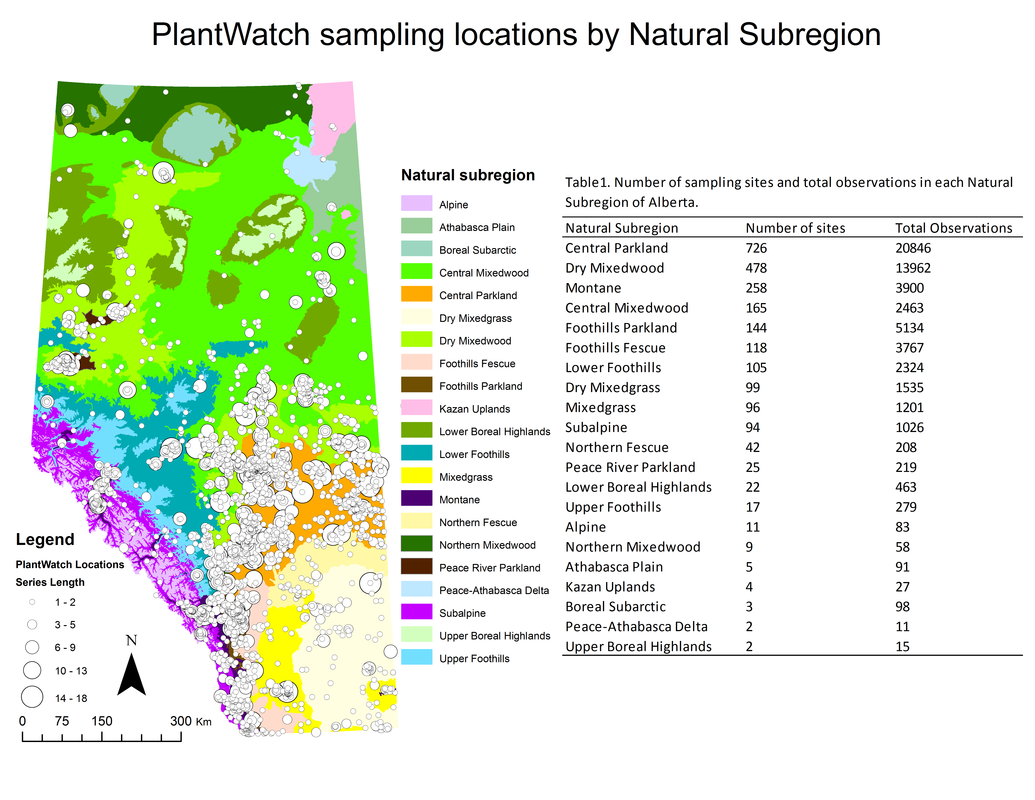
Figure 1. PlantWatch sampling locations in Alberta by Natural Subregion. Series length is the number of years from 1987-2016 for which we have phenological records at each location.
Table 2. Number of PlantWatch sampling sites for the six best sampled land cover classifications, in the ten best sampled Natural Subregions. The best represented combinations are highlighted.
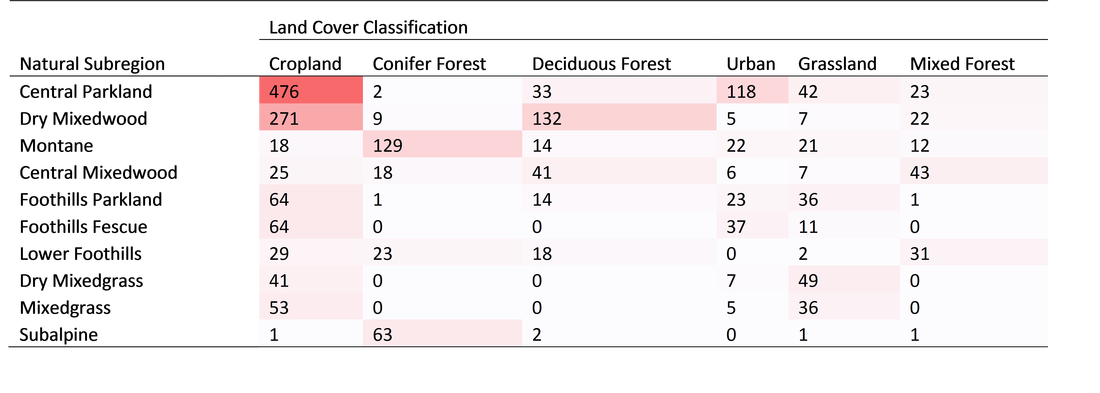
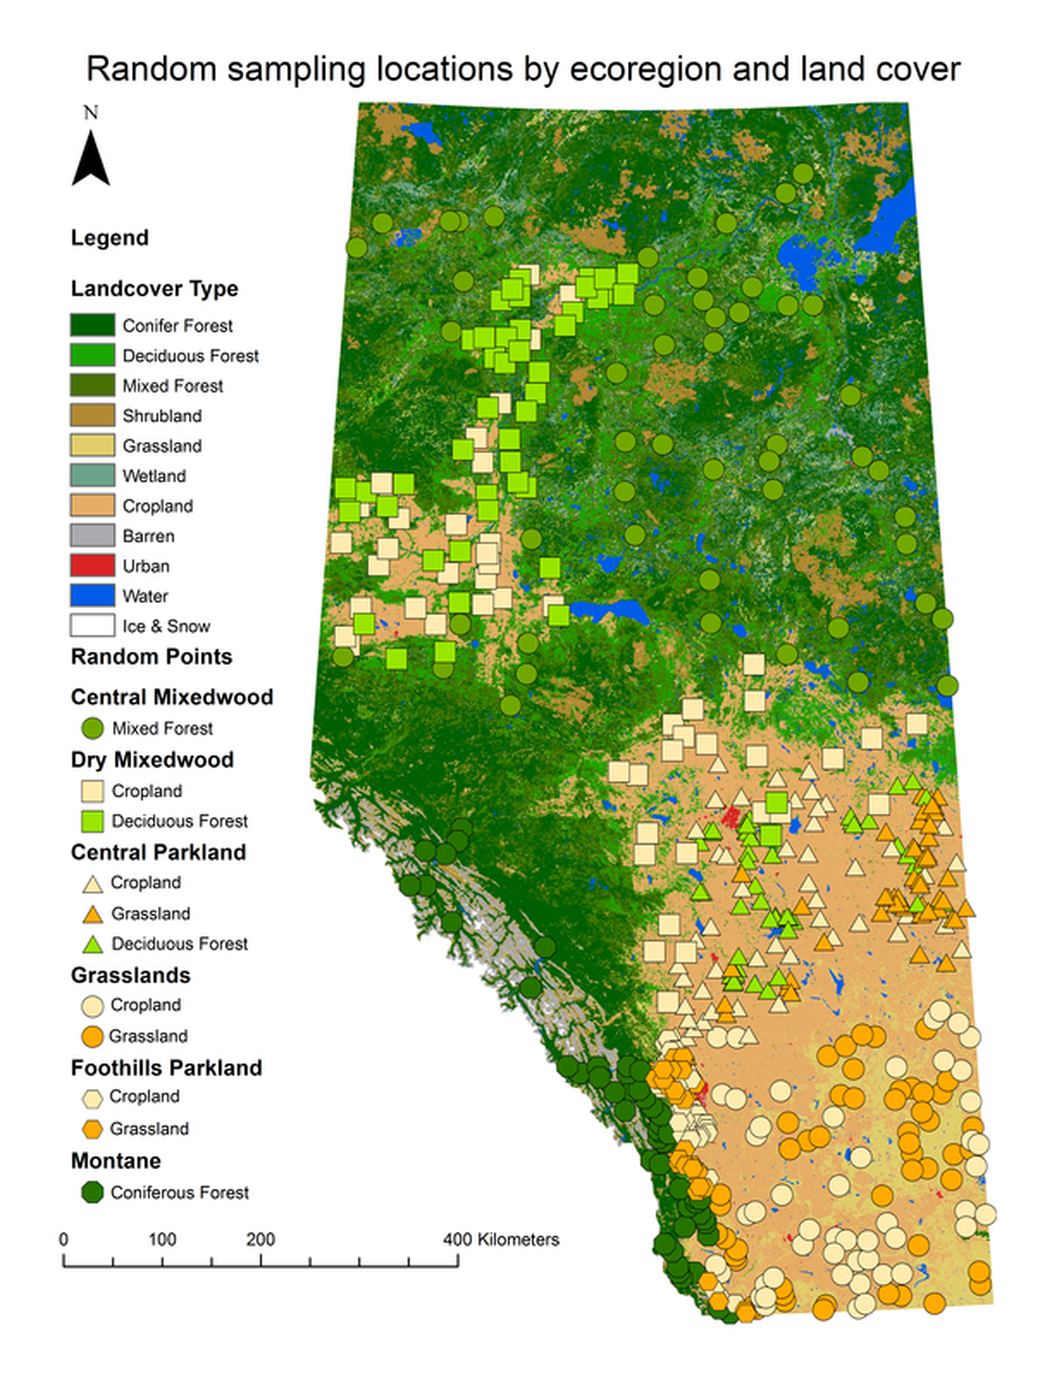
Figure 2. Locations of the random sampling points created to extract the remote sensing greenup dates.
Remote sensing
Remote sensing data from the NASA Vegetation Index and Phenology were extracted and used for this research. These are low resolution data which include start of greenup dates based on EVI (Enhanced Vegetation Index) and NDVI (Normalized Difference Vegetation Index) at a pixel size of 5600m for the entire Earth's surface from 1981-2014 (Didan and Barreto 2016a; Didan and Barreto 2016b) . The Alberta wide landsurface phenology dataset developed by Pickell et al. (2017) was also used in this research. These data estimate the greenup date based on half-maximum NDVI at a pixel size of 250m from 2000-2016. In the original study, these data were used to estimate the end of the spring fire season in Alberta's forested region.
Figure 3 shows the land surface phenology greenup dates of each remote sensing dataset in 2014. These data show some similarities and differences in this chosen year. All three datasets appear to be showing a relatively late greenup in the southeast portion of the province that is mainly cropland; however, there is a notable area in the very southeast corner, that is mainly grassland and shows an earlier green up. The cropland area in the northwest portion of the province also appears to be showing a later greenup, as compared to the surrounding forested area. Both NASA datasets have some clusters of pixels in the northern portion of the province that have strangely early greenup dates compared to their surroundings, while the Pickell data show no such anomalies.
The 550 random points shown in Figure 2, plus the additional 125 created for the Pickell data, were used to extract the greenup dates of the corresponding pixel from each remote sensing dataset for each year (1987-2014 for the NASA data, 2000-2016 for the Pickell NDVI data). These data were then used to determine the mean greenup date for each Natural Subregion - landcover combination in each year, for each remote sensing dataset.
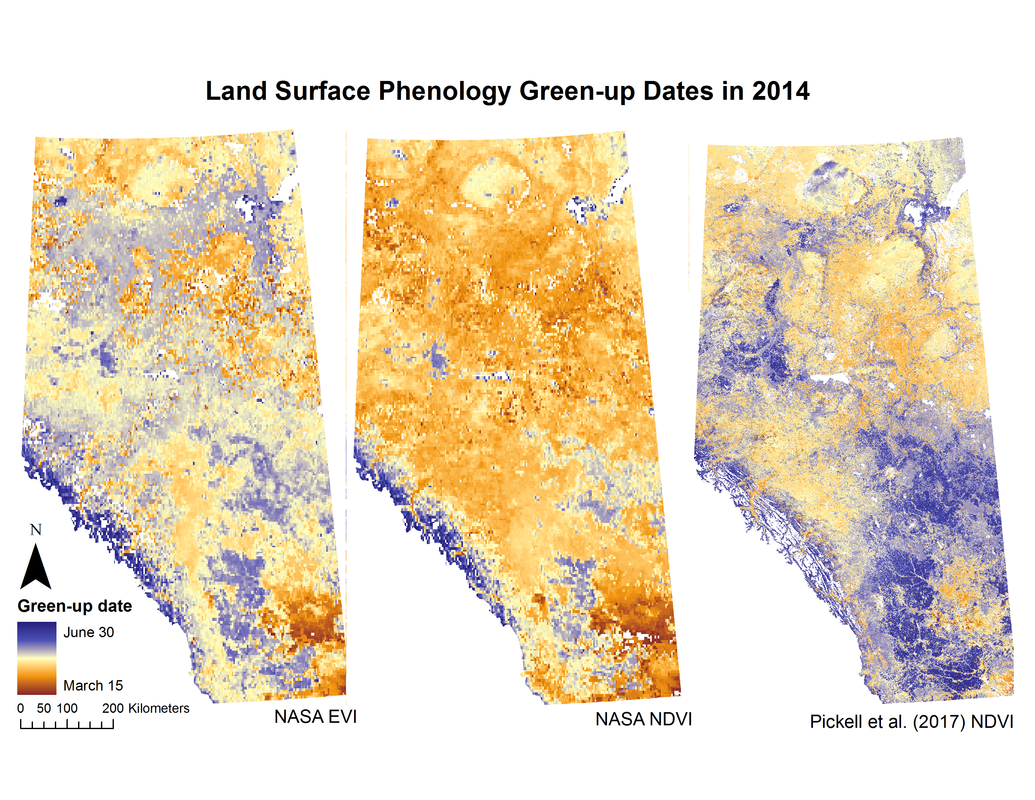
Figure 3. Land surface phenology relative greenup dates in 2014 based on the three different remote sensing databases.
Statistical analysis
For each of the 11 Natural Subregion - landcover combinations, we tested the statistical significance (α = 0.05) of the correlation between the mean greenup date, for each remote sensing dataset, and the estimated aspen leaf-out (phase 4) and saskatoon bloom (phase 1) date. These two species were chosen to represent the ground-based greenup dates because they are both widespread across the province, and are among the four best recorded species in the PlantWatch dataset (Table 4). While aspen phase 1 (first bloom or pollen shed) had considerably more observations, we chose to use leaf-out (phase 4) because the widespread leafing-out of aspen is likely to be a strong contributor to the satellite measurements of "greenness" on the landscape. Thus, we can reasonably expect aspen leaf-out to be a stronger contributor to remote sensing based greenup than aspen first bloom.
