Results
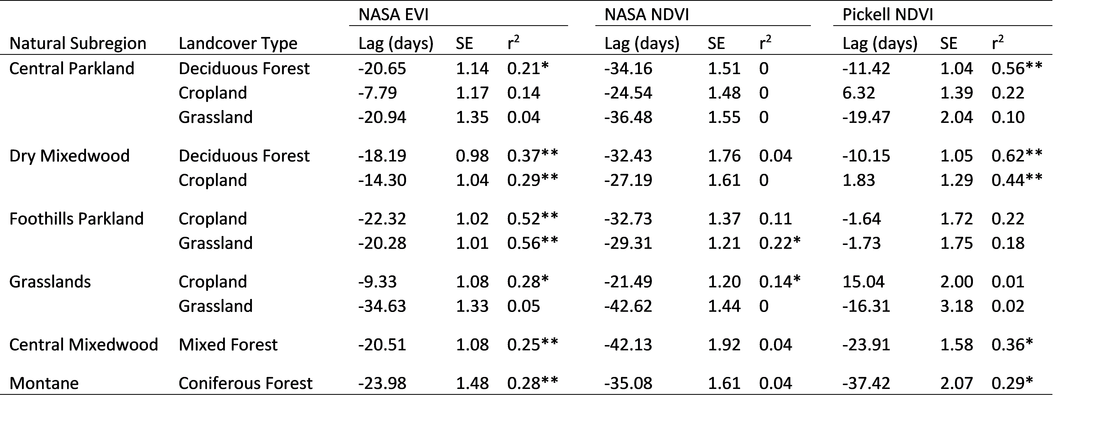
Correlations between the ground-based leaf-out or bloom dates and the remote sensing greenup dates were variable between the two species, the three remote sensing datasets, and the different Natural Subregion landcover combinations (Table 5, Table 6). There was a significant correlation between the NASA EVI greenup dates and the ground-based dates for both aspen and saskatoon for the following natural subregion - landcover combinations: deciduous forest in the Central Parkland, deciduous forest and cropland in the Dry Mixedwood, cropland and grassland in the Foothills Parkland, cropland in the grasslands region, and mixed and coniferous forest cover in the Central Mixedwood and Montane regions, respectively. Greenup dates based on the NASA NDVI data were significantly correlated with ground-based dates for aspen leaf-out only for: cropland and grassland in the Foothills Parkland, and for saskatoon bloom dates for grassland in the Foothills Parkland and cropland in the grasslands region. Dates from the Pickell et al. NDVI data had significant correlations with ground-based dates for both aspen and saskatoon for all forested landcover types, as well as for cropland in the Dry Mixedwood region.
Table 5. For each natural subregion - landcover combination, the average lag (in days; predicted from remote sensing data minus observed (ground-based) date), standard error of the lag, and r^2 value and significance (*p<0.05, ** p<0.01) for the correlation between the remote sensing greenup date against the observed ground-based date for aspen leaf-out.
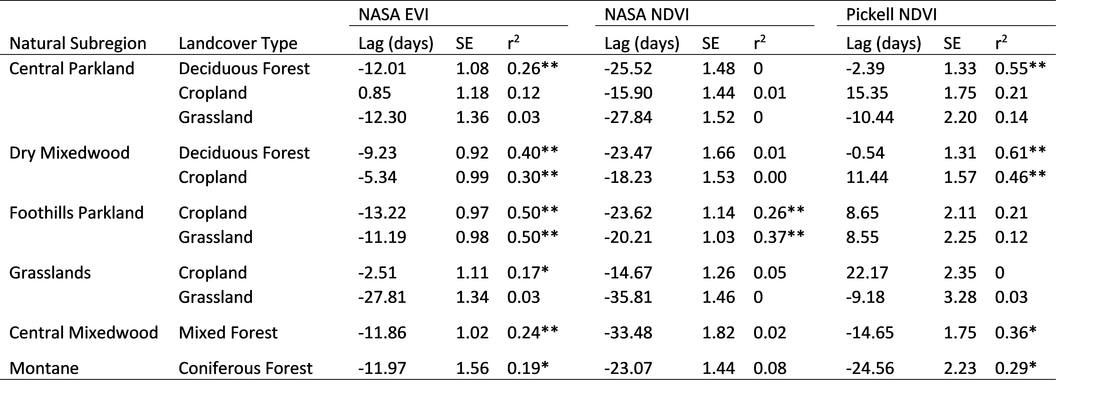
Table 6. For each natural subregion - landcover combination, the average lag (in days; predicted from remote sensing data minus observed (ground-based) date), standard error of the lag, and r^2 value and significance (*p<0.05, ** p<0.01) for the correlation between the remote sensing greenup date against the observed ground-based date for saskatoon first bloom.
Aspen and saskatoon leaf-out/bloom (ground-based) dates appear to be much more variable than the remote sensing greenup dates (Figure 5). Only the Pickell NDVI data appear to have the same inter-annual variability as the aspen and saskatoon data. The NASA EVI/NDVI greenup dates appear to follow the general trend of inter-annual variation as the aspen/saskatoon data in some cases, though the early years (e.g. 1992) and late years (e.g. 2002) don’t correspond well.
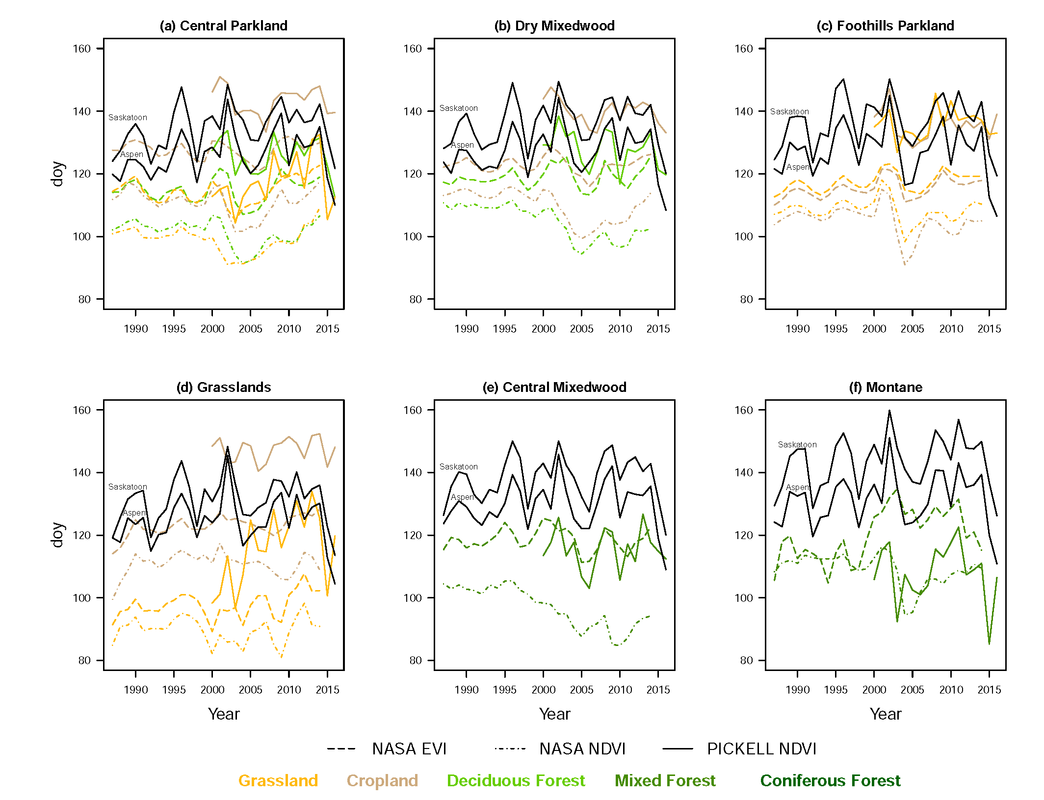
Figure 5. Time series showing the remote sensing greenup dates as well as the estimated aspen leaf-out and saskatoon bloom dates in each Natural Subregion by landcover type (colour coded) for the three different remote sensing datasets.
The remote sensing greenup date was generally earlier than aspen leaf-out, except for the Pickell NDVI data (Table 5, Figure 6). The greenup date from the Pickell NDVI data was nearly identical to the aspen leaf-out date for deciduous forest cover in both the Central Parkland and Dry Mixedwood, and was just over 10 days later than aspen leaf-out for the cropland cover in the Dry Mixedwood. The NASA NDVI and EVI greenup dates were earlier than aspen leaf-out for all the significant correlations, and this ranged from a few days earlier for the cropland in the grasslands region (NASA EVI data), to over 20 days earlier for both landcover types in the Foothills Parkland with the NASA NDVI data.
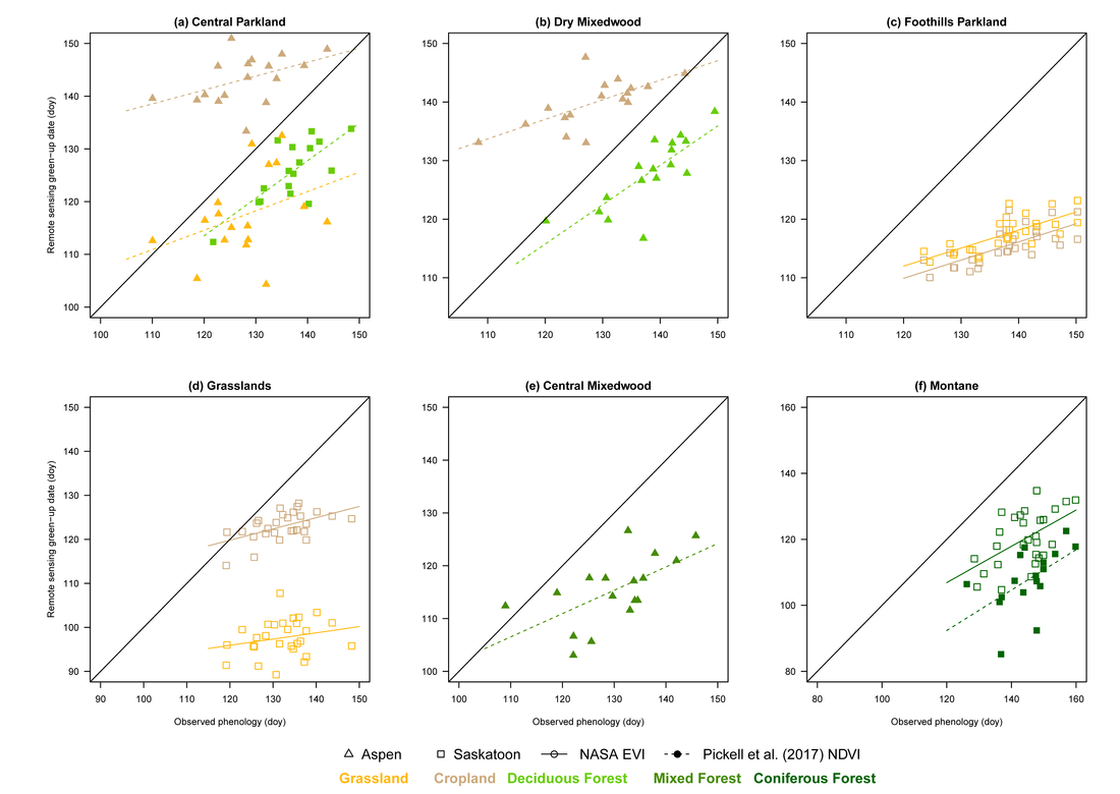
Figure 6. Scatter plots of the remote sensing greenup date in relation to the estimated saskatoon bloom or aspen leaf-out date for the results that had the highest r^2 values in each Natural Subregion-landcover-species combination.
